The India GDP is a combination of all the differential factors, contributing to the welfare of the India economy. India GDP gives us a combined report of the performance of the Indian economy. 'Cost factor' or 'Actual price' method - these are the two methods to calculate Indian Gross Domestic Product. The main factor that contributed to the growth of India GDP post 1990s was the opening-up of the Indian economy...
The balance-of-payments crisis of the 1980s of the Indian economy led to the paradigm shift of the Indian Economy. The markets were opened up; the Government leveraged the entry of private investments. As a result of this, more investments flowed into the markets. More so by the foreign direct investments (FDIs) and foreign institutional investors (FIIs), the India GDP growth saw a phenomenal increase. Bulk of the Government undertakings were divested into lots of private business houses.
Gauging the health of the India economy - India GDP is the best tool! Going by figures, India GDP has already crossed the trillion-dollar mark, other peers in this sphere being US, Japan, Germany, China, UK, France, Italy, Spain, Canada, Brazil and Russia. After the liberalization era of the India economy, the growth story of the India GDP was driven by the following sectors of Indian industry -
Below is a table that shows the year wise comparison of India's GDP from the year 2003 to 2011
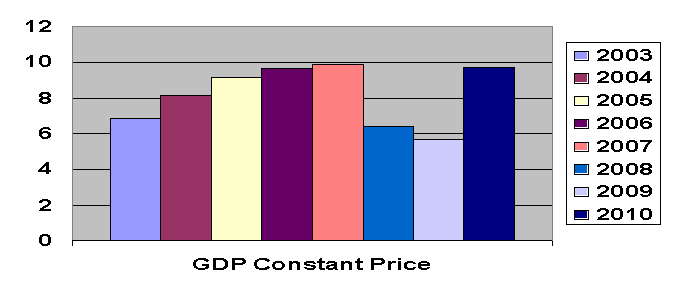
Below is a table that shows the year wise comparison of India's Constant Price GDP from the year 2003 to 2011
Graph on Constant GDP of India from 2003 to 2011
The balance-of-payments crisis of the 1980s of the Indian economy led to the paradigm shift of the Indian Economy. The markets were opened up; the Government leveraged the entry of private investments. As a result of this, more investments flowed into the markets. More so by the foreign direct investments (FDIs) and foreign institutional investors (FIIs), the India GDP growth saw a phenomenal increase. Bulk of the Government undertakings were divested into lots of private business houses.
Gauging the health of the India economy - India GDP is the best tool! Going by figures, India GDP has already crossed the trillion-dollar mark, other peers in this sphere being US, Japan, Germany, China, UK, France, Italy, Spain, Canada, Brazil and Russia. After the liberalization era of the India economy, the growth story of the India GDP was driven by the following sectors of Indian industry -
- Information Technology
- Information Technology Enabled Services
- Telecommunications
- Electronics and hardware
- Automobiles
- Pharmaceuticals and biotechnology
- Consumer durables
- Retail
- Textiles
- Infrastructure
- Construction
- Airlines
- Hospitality
- Power
- Oil and natural gas
- Fertilizers and chemical
Factors governing the Indian Economy
- GDP (purchasing power parity) $4.046 trillion (2010)
- GDP - per capita (PPP) $3,400 (2010)
- GDP (official exchange rate) $1.43 trillion (2010)
- GDP - composition by sector Services: 55.3% (2010 est.) Industry: 28.6% Agriculture: 16.1%
- India Budget Revenues: $170.7 billion Expenditures: $257.4 billion (2010)
- Unemployment rate 10.8% (2010)
- Labor force: 478.3 million (2010)
- Labor force divided by occupation Agriculture: 52 percent Industry: percent Services: 34 percent (2009)
- Population below poverty line 25 percent (2007)
- Household income in India or consumption by percentage share Highest 10 percent: 31.1 percent (2005) Lowest 10 percent: 3.6 percent
- Distribution of family income - Gini index 36.8 (2004)
- Inflation rate (consumer prices) 11.7 percent (2010.)
- Public debt
55.9 percent of GDP (2010.)
- Central bank discount rate
6 percent (31 December 2009)
- Commercial bank prime lending rate
12.19 percent (31 December 2009)
- Reserves of foreign exchange and gold in India
$284.1 billion (31 December 2010)
- Agriculture - products in India
Rice, wheat, lentils, cotton, jute, tea, oilseed, jute, sugarcane, onions, potatoes; sheep, dairy products, poultry, goats and fish - India Industries
Textiles, petroleum, food processing, software, chemicals, steel, transportation equipment, cement, mining, machinery and pharmaceuticals
- Import partners of India
US 7.16%, Saudi Arabia 5.36%, China 10.94%, Australia 5.02%, Germany 4.86%, UAE 5.18% and Singapore 4.02% (2009)
- Industrial production growth rate in India
9.7 percent (2010)
- Electricity production in India
723.8 billion kWh (2009)
- Electricity consumption in India
568 billion kWh (2007)
- Electricity imports in India
5.27 billion kWh (2009)
- Electricity exports in India
810 million kWh (2009)
- Oil - production in India
878,700 bbl/day (2009)
- Oil imports in India
2.9 million bbl/day (2007)
- Oil exports in India
738,600 bbl/day (2007)
- Natural gas production in India
38.65 billion cu m (2009)
- Natural gas consumption in India
51.27 billion cu m (2009
- Import commodities in India
Crude oil, fertilizer, machinery, precious stones, steel, iron and chemicals
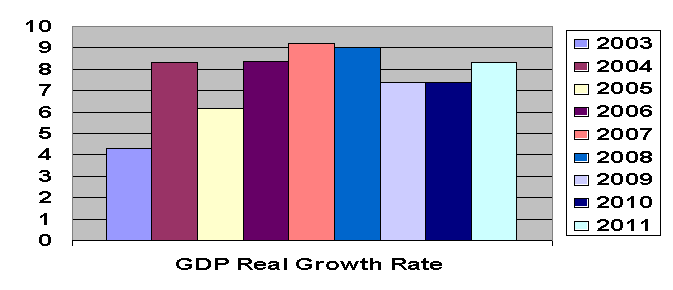
Year wise comparison of India's GDP
Below is a table that shows the year wise comparison of India's GDP from the year 2003 to 2011
| Year | GDP Real Growth Rate |
| 2003 | 4.30 percent |
| 2004 | 8.30 percent |
| 2005 | 6.20 percent |
| 2006 | 8.40 percent |
| 2007 | 9.20 percent |
| 2008 | 9.00 percent |
| 2009 | 7.40 percent |
| 2010 | 7.40 percent |
| 2011 | 8.30 percent |
Graph on GDP of India from 2003 to 2011
Below is a table that shows the year wise comparison of India's Constant Price GDP from the year 2003 to 2011
| Year | GDP Constant Price |
| 2003 | 6.852 |
| 2004 | 8.106 |
| 2005 | 9.167 |
| 2006 | 9.658 |
| 2007 | 9.886 |
| 2008 | 6.396 |
| 2009 | 5.678 |
| 2010 | 9.668 |
Interesting Facts about Outsourcing in India
- Indian outsourcers will earn $220-280 billion by 2012
- Outsourcing consists of 7 percent of India's GDP
- The outsourcing companies in India will earn $10.73 billion by 2011
- Outsourcing witnessed a striking growth of 8.1 percent in 2008
- Salaries of the Indian software industry went up 18.7 percent in 2006
- Human Resource services went up by 8 percent in India in 2006
- Small scale business enterprises that outsource IT services in India end up spending about 5 percent on maintenance and up gradations
- Human Resource outsourcing increased by almost $18.9 billion in 2010
- IT offshore expenses in India reached $29.4 billion in 2010
- Outsourcing of Mobile network grew to $55.3 billion in 2010
- The back office and software industry in Indian generated $23.6 billion in the year fiscal 2005-2006
- The total revenue generated by the Outsourcing industry in India is $23.4 billion
- The Business process outsourcing market went up 33 percent in 2005
- 29,000 jobs were available in India in 2008
- The outsourcing industry in India employs about 1.2 million people and contributes $23.4 billion to the Gross Domestic Product
- 38% of multinational companies plan to change the distribution of their research and development centers within the next 3 years
- The Desktop management outsourcing in India reached $28 billion in 2005
- Export of services and software from India reached $17.2 billion in the fiscal year 2005
- The test outsourcing and Packaging industry in India reached $15.5 billion in 2005
- The number of outsourcing contracts went down by 10-15 percent in 2005
- The Indian outsourcing industry brought in $12 billion in 2004
Indian Energy Industries plays a major role in Indian GDP. But these days Indian Political Leaders merged with corrupted people. There are lots of money scams happened in India. This is not the good sign of country's GDP.
ReplyDeleteBest Regards
Virgin Polymers